The Attribution Dashboard
The Attribution section gives everyone on the team visibility into how sample activity connects to revenue. Every user can see both their own attribution data and the team-wide view.
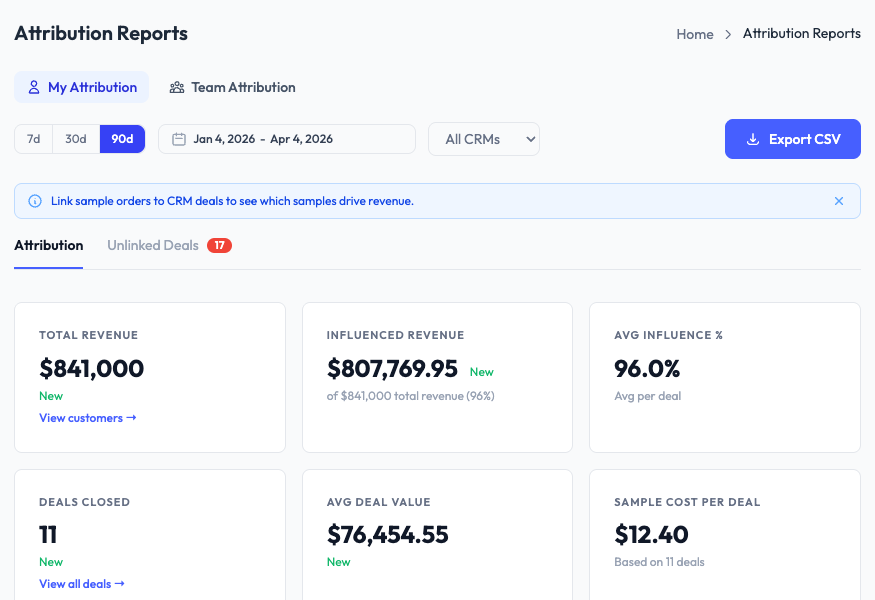
My Attribution
The default view when you open Attribution Reports. It shows your personal attribution KPIs: Total Revenue, Influenced Revenue, Average Influence %, Deals Closed, Average Deal Value, and Sample Cost Per Deal.
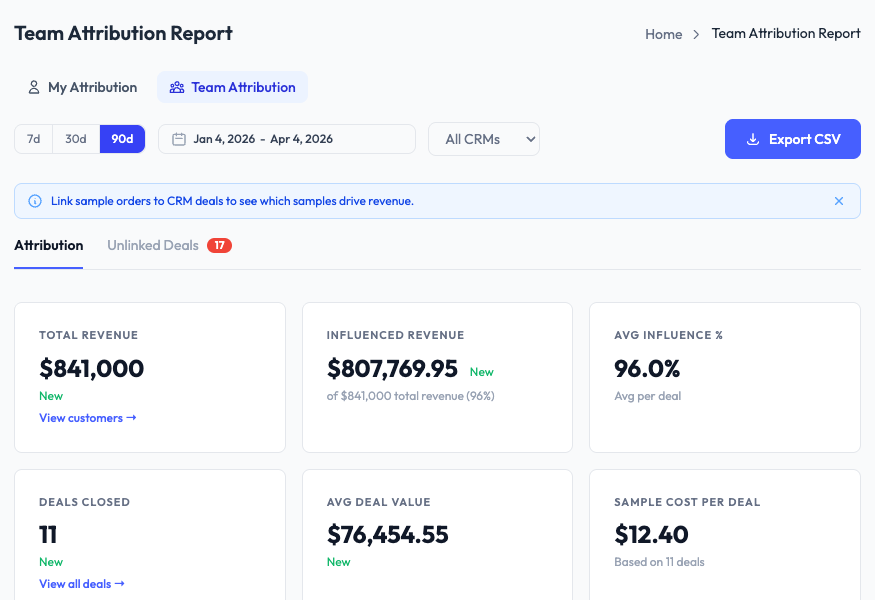
Team Attribution
Click the Team Attribution tab to see the same KPIs aggregated across all reps. This gives everyone context on how the team’s sampling program is performing overall.
Unlinked Deals
The Unlinked Deals tab shows closed CRM deals that have no sample orders linked to them. Use this to identify deals where your team may have sent samples but forgot to link them.
Linking deals to orders
Attribution data starts with linking CRM deals to sample orders. There are several ways to create these links. See Linking Deals to Orders for a full walkthrough of all methods.
Filters
Use the date range selector (7d, 30d, 90d, or custom range) and CRM filter to narrow the data. You can also export the current view as a CSV.