Owner and Manager Dashboard
Updated Apr 4, 2026
Dashboard and Analytics
The owner and manager dashboard gives you full visibility into your team’s sample operations.
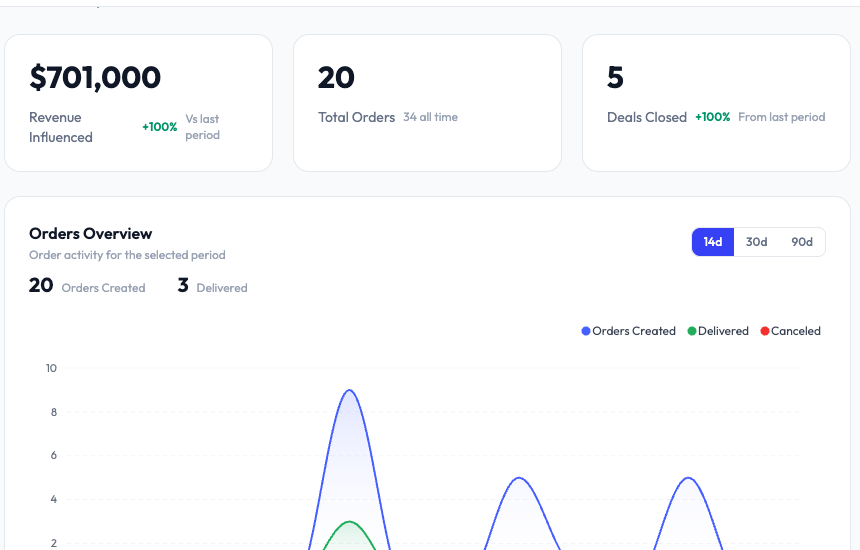
KPI cards
- Revenue Influenced: Total dollar value attributed to samples, with comparison to the previous period.
- Total Orders: Number of orders created, with an all-time total.
- Deals Closed: Number of CRM deals linked to sample orders, with period-over-period change.
Orders Overview chart
A line chart showing order activity over time. Toggle between 14-day, 30-day, and 90-day views. The chart tracks Orders Created, Delivered, and Cancelled.
Additional sections
- Top Performing Samples: Which samples appear most frequently in orders.
- Recent Activity: Latest order and status change events.
- Work Queues: Orders needing attention.